
Running a small business is like managing a bustling marketplace. You’ve got different products, eager customers, and a whole lot of activity to keep track of. Google Analytics is like your high-tech market assistant, whispering valuable insights through charts and graphs on your dashboard. But what do all those numbers mean? Don’t worry, because this guide is here to translate the analytics lingo and turn your dashboard into a crystal-clear roadmap for success.
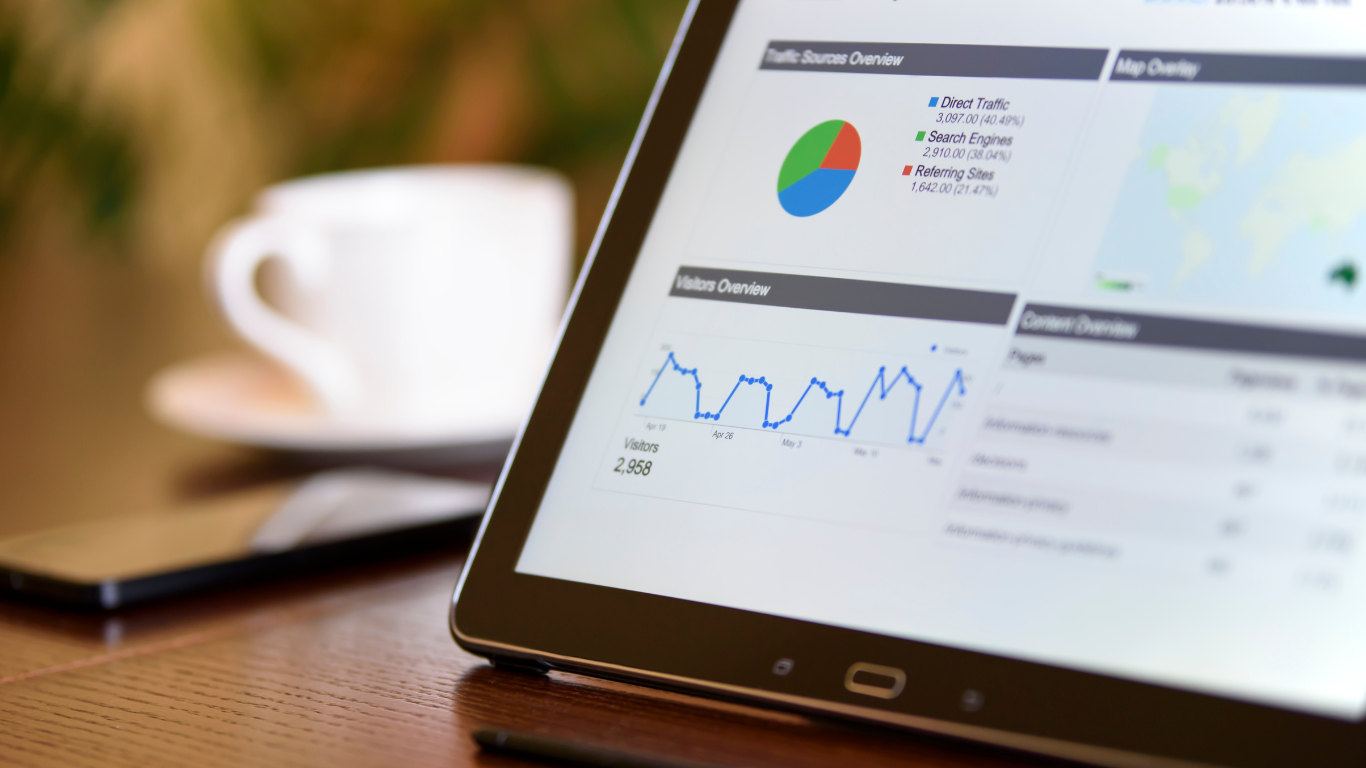
Think of your website as a virtual storefront. Every time someone walks in (clicks a link), Google Analytics takes note. It captures what they look at (pages visited), what they buy (conversions), and even how long they stay (session duration). All this information gets crunched into numbers and visuals on your dashboard, like the number of visitors, bounce rate (visitors who leave quickly), and even top-performing pages.
But the real magic lies in understanding the key players:
- Unique Visitors: Like counting unique customers in your store, this tells you how many new people visited your website.
- Page Views: Imagine counting how many times someone picks up an item. This shows how many times your web pages were loaded.
- Bounce Rate: Think of someone walking in and immediately walking out. This measures how many visitors leave without browsing further.
- Average Session Duration: How long do people stay in your store before leaving? This shows the average time visitors spend on your website.
- Conversions: The ultimate sale! This counts how many times visitors took a desired action, like making a purchase or signing up for your newsletter.
Remember, Google Analytics is your partner in progress. Use its insights to:
- Identify your top-performing pages: Focus on what works and repeat the recipe for success!
- Understand your visitors’ journey: See where they’re getting lost and make your website easier to navigate.
- Track the effectiveness of your marketing campaigns: Are your ads bringing in the right kind of customers? Google Analytics tells you!
- Set goals and measure your progress: Aim for 10% more unique visitors this month? You can track your progress on the dashboard!
Don’t get intimidated by the numbers. Google Analytics offers plenty of resources and tutorials to help you understand the data. Remember, even small improvements can make a big difference in your online success.
So, the next time you open your Google Analytics dashboard, think of it as your friendly market assistant, eager to share valuable insights and help you take your small business to the next level. With a little understanding and some strategic tweaks, you can transform your website into a magnet for customers and watch your business thrive!
If you’re still feeling lost, AdaptiServe, Richmond’s IT consulting experts, are always happy to lend a hand! Drop them a line for personalized Google Analytics guidance and watch your dashboard become your best friend, not your biggest mystery.
No responses yet